Normally, REXX's built-in debugger is turned off, But you can enable it, with various options, via the TRACE instruction. The desired options are listed after the TRACE keyword. The following options are allowed:
Option Meaning ? Turns the debugger on with an auto-breakpoint at the first instruction after the TRACE. (ie, The debugger initially starts up in Step mode). A (Add-on) Turns the debugger on with an auto-breakpoint at any call to a function in an external function library (such as a call to some REXX Dialog function). The breakpoint is after the arguments passed to the subroutine/function have been evaluated, but before the actual call. C (Commands) Turns the debugger on with an auto-breakpoint at the end of any command issued to some Environment. E (Error) Turns the debugger on with an auto-breakpoint at the end of any instruction upon which the ERROR or FAILURE condition is raised. F (Failure) Turns the debugger on with an auto-breakpoint at the end of any instruction upon which the FAILURE condition is raised. I (Internal) Turns the debugger on with an auto-breakpoint at any call to a subroutine/function inside of your script, or upon the first instruction in another script. The breakpoint is after the arguments passed to the subroutine/function/script have been evaluated, but before the actual call. L Turns the debugger on with an auto-breakpoint at each label. This includes the label before any subroutine/function inside of your script, or any jump to some label via the SIGNAL statement. Also, there is an auto-breakpoint before the first instruction of any script you call. N (Normal) Turns the debugger on, clearing all other options except for '?'. O (Off) Turns off the debugger and closes the debugger window. R (Raise) Turns the debugger on with an auto-breakpoint at the end of any instruction upon which some condition is raised.
Unless you turn on the TRACE_OPTS option via the instruction:
OPTIONS 'TRACE_OPTS'...or enable the REXX Administration Tool's "Multiple TRACE options" option, then you can enable only one of the above options at a time, (except that the ? option can be used with any other option except O). This is similiar to standard REXX.
But if you enable the TRACE_OPTS option, then you can combine the above options, except for the 'O' and 'N' options. These are mutually exclusive with all others (with the exception that N can be used with ?), including themselves. (ie, an option of 'ON' is equivalent to only 'N').
For example, to turn on the built-in debugger with the 'A', 'I', 'R', and '?' options, you use the instruction:
TRACE '?AIR'For example, to turn off the built-in debugger, you use the instruction:
TRACE 'O'The Reginald REXX Administration Tool can also be used to turn on/off the debugger with the above options. The advantage of using the Administration Tool is that you don't need to edit your script to insert and delete TRACE instructions. You do not even need to save the Administration Tool settings, nor restart your script. (Although, you can save settings if you wish each script to always use some default setting). Changes you make in the Administration Tool window will become immediately effective in the running script. So, the Administration Tool is handy for quickly enabling/disabling debugger features while a script is running, without needing to edit the script.
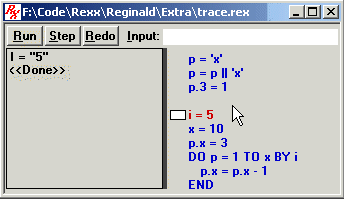
The Debugger window looks like so:

On the lower right side of the window (where the mouse pointer is shown) are the instructions in your script, exactly as you typed them. The instruction that is about to be executed, or is currently being executed, is highlighted in the color red. (Above, that is the instruction i = 5). The other instructions are in blue.
To the left of the instructions is the RESULTS box. Reginald displays information in this box as an instruction is executed. The information concerns only the instruction currently being executed (although it may also contain information about a preceding instruction if you have made a call to some subroutine/function).
At the top of the window are 3 buttons. Assuming that your script is not yet running (ie, you have previously clicked on the Stop button, or used the '?' option with the TRACE instruction, or selected "Step" mode using the Administration Tool), these buttons are labeled "Run", "Step", and "Redo".
To the right of these is a box labeled "Input" into which you can type REXX instructions to have them executed on-the-fly. (The debugger does not debug instructions you enter into the INPUT box. This is only meant to do such things as query the value of your variables, or set them to new values, or jump to various places in your script to debug from there).
If you click on the "Run" button, the debugger will start executing your instructions, one after the next, just like the interpreter will normally do. The debugger's "Run" button will also change to read "Stop".
The debugger window will highlight each REXX instruction as it is executed and show its results in the RESULTS box. Normally, a REXX script executes very fast, compared to the human eye, so the display will flash information faster than you can probably read it. If you wish the script to continue running, but at a slower pace, then you can click on the "Step" button (while the script is running). This will kick the debugger into a "slow run" mode. Clicking on the "Step" button again will turn this mode off, and return to "normal run" mode.
You can also set the speed of the "slow run" mode. The Administration Tool has a "Run Speed" box into which you can enter a numeric value for the speed, and press ENTER. Higher numbers will yield a slower speed.
The script will continue running until it encounters an auto-breakpoint (ie, as determined by which of the TRACE options you used above), or you click on the "Stop" button. At that point, the debugger will pause (ie, break) your script upon the current instruction. You can then see which instruction the debugger paused at, and view its results. At that point, you can also type into the INPUT box, or click the "Redo" or "Step" buttons, or even click the "Run" button again to resume executing your script from the point where it stopped.
You can manually set a breakpoint at any instruction. Just move your mouse pointer over the instruction, and click the left mouse button twice, very fast. A small white rectangle will appear next to the instruction. In the above picture, a breakpoint has been set on the instruction "i = 5".
Now when you click the "Run" button, the debugger will run your script until it encounters the next auto-breakpoint, or one of your manual breakpoints, or you click the "Stop" button.
You can simultaneously set as many breakpoints as you like.
To remove a particular breakpoint, just double-click on that same instruction again, and the white rectangle will disappear.
You can also toggle a breakpoint at the current instruction by pressing the ENTER key.
Note: A breakpoint on an END instruction is ignored. You should instead set the breakpoint on the respective DO, SELECT, or WHEN instruction.
Sometimes, rather than running the script to a certain breakpoint, you'd prefer to single-step through each instruction so that you have time to observe the information for each instruction in the RESULTS box. You merely click on the "Step" button (while the script is paused, and the "Run" button is displayed) and it will execute the next step of the current instruction. A simple REXX instruction may have only one step. But a complex REXX instruction will likely have more than one step. If so, you may need to click on the Step button several times for that instruction. As you do, the debugger will continue to highlight that instruction and accumulate the results of each step. After the last step is executed for a given instruction, the debugger displays <<Done>> in the RESULTS box. When you click the Step button again, it advances to (highlights) the next instruction and executes that instruction's first step. The RESULTS box is cleared (of the preceding instruction's results) so that you can now observe the results of only this next instruction.
Let's take an example. We'll assume that the debugger has just gotten to the end of the instruction before the instruction i = 5. (ie, That preceding instruction is still highlighted and all of its results are being shown). You click on the "Step" button once. The RESULTS box is cleared, the instruction i = 5 is highlighted, and the first step of this instruction is executed. The RESULTS box then displays the results of that step. You should see the following in the RESULTS box:
i = "5"
<<Done>>
The line i = 5 means that the variable named i was used in your instruction and its current value is shown after the equal sign. The value is shown between double quotes (although the quotes are not part of the actual value). This is just so that you can better see any leading or trailing spaces on the value. Indeed, since our instruction set i to the value 5, it makes sense why the debugger is confirming this.
It just so happens that this simple instruction has only one step, and so you'll see <<Done>>. Now you can click the Step button again to clear the RESULTS box and advance to the first step of the next instruction.
Let's assume that the next instruction is p = i. You should see the following results:
i = "5"
p = "5"
<<Done>>
The debugger is reporting that the variable named i is being used in this step, and its current value is 5. The variable named p is also being used in this step, and its current value is now 5 (since our instruction assigned it that value).
This instruction also has only one step, so if you click on the "Step" button again, it will advance to the next instruction. Let's assume that next instruction is i = i + p. You should see the following results:
i = "5"
p = "5"
Addition: 10
i = "10"
<<Done>>
The debugger is reporting that the variable named i is being used in this step, and its current value is 5. The variable named p is also being used in this step, and its current value is 5. The line starting with Addition means that a mathematical addition operation has been performed. In this case, we've added the values of i and p, and the result of that operation (ie, 5 + 5) in shown. Finally, the variable named i is being used once more in this step, and its current value is now 10 (since our instruction assigned it the value of that addition operation).
If you happen to reference a compound variable whose tail names are not all numeric, then tail name substitution is performed. The debugger will show this in the RESULTS box by listing each tail name (that will be substituted) and showing its current value. The debugger also then shows the real name of the compound variable with tail name substitution, along with its current value. For example, let's say that we now have the instruction myvar.i.p = "hello". You should see the following results:
i = "10"
p = "5"
MYVAR.10.5 = "hello"
<<Done>>
Above, we've used the variables i and p as tail names in our compound variable myvar.i.p. So, the debugger first shows us the current values of those variables. They are 10 and 5, respectively. Then the debugger shows us the real name of our compound variable, after substituting those non-numeric tail names with their values. It is MYVAR.10.5. That is the real variable whose value is set to the string "hello".
Let's assume that you have a subroutine or function within your script. You have labeled this subroutine/function MySub, and written it to return the value of the variable named SomeVar. Here is how your instructions may look:
MySub:
   RETURN SomeVar
Let's say that you also make a call to this function, passing it the value of a variable named MyVar (which happens to have the value 10) and you assign the return of this function to a variable named AnotherVar. Here is our completed script:
TRACE '?N'
MyVar = 10
AnotherVar = MySub(MyVar)
EXIT

MySub:
   RETURN SomeVar
As you may guess, the function call to MySub is going to involve more than one step since we have to execute all of the instructions in MySub before our instruction AnotherVar = MySub(MyVar) completes, and we move on to the EXIT instruction following it.
Let's take the debugger through this script by clicking on the Step button and observe the results.
The debugger opens as soon as it encounters the TRACE instruction and pauses at the end of that instruction. If you click upon the Step button, it will execute the first step of the next instruction, and you will see the following in the RESULTS box:
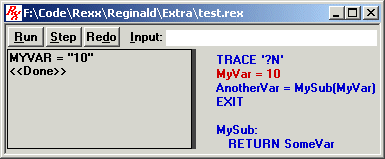
The debugger indicates that the variable named MYVAR is being referenced, and its current value is 10 (as you may expect).
There are no more steps to this instruction, so if you click upon the Step button, the debugger will advance to the next instruction, highlight it, and execute its first step. You should see the following in the RESULTS box:
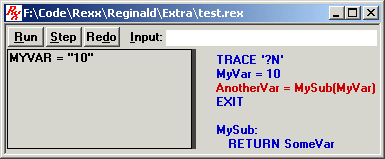
Because this instruction involves a call to a subroutine/function, the first step is to evaluate the value of each argument being passed to that subroutine/function. Here, we have only one argument. The debugger shows that we're referencing the variable named MYVAR, and its current value is 10.
The debugger pauses after evaluating the arguments passed to a subroutine/function, but before actually diving into that subroutine/function. That's the end of this step. But this instruction is not yet done. (Notice that <<Done>> is not yet displayed). We still have to call MySub, execute all of its instructions, and return. Now click the Step button again, and the debugger will dive into MySub. You should see the following in the RESULTS box:
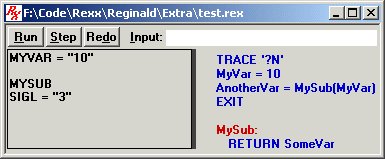
The debugger now jumps to the label of our subroutine, MySub, and highlights it. You'll notice that there is a blank line in the RESULTS box, followed by the name of the subroutine called, in this case, MySub. MySub also indicates that the special SIGL variable has been set to the line number upon which MySub was called.
You'll also note that the RESULTS box still shows the evaluated args that were passed to MySub. These are shown above the name of the subroutine. That's because we're not yet done with that instruction which called MySub. We still have more results to show for it... after we return from MySub.
If you click on the Step button, the debugger will advance to the first line of the subroutine, highlight it, and execute its first step. You should see the following:
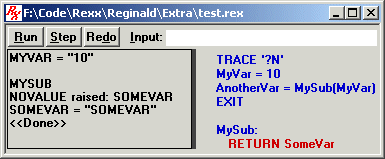
Note that any previous lines shown for MySub() are cleared away now that they're done. (So, you no longer see SIGL's value).
Here we have something interesting. You'll note that our script hasn't previously assigned the variable "SomeVar" any value. Whenever a variable is referenced, but has not yet been assigned a value, REXX raises the NOVALUE condition. The RESULTS box indicates that the NOVALUE condition has been raised upon this instruction due to the variable named "SomeVar".
Since our script didn't trap NOVALUE via a preceding SIGNAL ON statement, then REXX does the default handling for this condition, which is to simply ignore it. The debugger has nevertheless informed us of this condition being raised.
And of course, since we have indeed referenced the variable "SomeVar", the RESULTS box shows its current value, which is the name of the variable upper-cased. (Recall that when a REXX variable is not assigned any particular value, its "default value" is its name, upper-cased).
This instruction has only one step, so if you click the Step button again, the debugger advances to the next instruction in the subroutine. But of course, there is no more instructions in the subroutine because we have just done a RETURN instruction. So, the debugger returns to the instruction that called MySub. You should see that instruction highlighted again, as so:
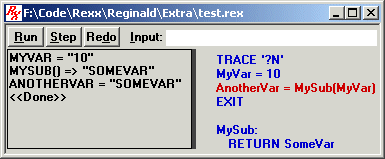
You'll also note that the debugger clears away the results of MySub, now that we're no longer executing instructions in MySub, and it proceeds to the next step of the current instruction. That step is to assign the return value of MySub to the variable named ANOTHERVAR. You'll notice that the debugger shows that MySub returned the value "SOMEVAR". It does this by displaying the name of the subroutine, followed by parentheses and a => symbol. The returned value is in double quotes, although they are not part of the actual value.
Finally, the debugger shows that the variable named ANOTHERVAR is referenced and its current value is now "SOMEVAR". That is the end of the final step of this instruction.
If you click on the Step button again, the debugger will advance to the next instruction, which is the EXIT instruction, as so:
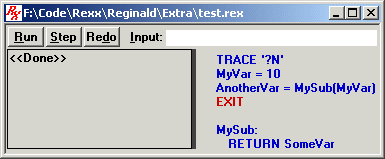
This EXIT instruction has only one step, so if you click upon the "Step" button, the script will end now.
You can click inside of the RESULTS box, and a cursor will appear (just like in the INPUT box). You can then use the arrow keys to scroll around the text in the RESULTS box, to view text that may be past the edge of the box.
You can also resize the RESULTS box. You'll notice that the right edge of the RESULTS box is a bit thicker than the other edges. If you move the mouse pointer over this edge, the pointer will change shape. You can then click and hold down the left mouse button to "grab" this edge, and slide it left or right to resize the width of the RESULTS box. Below, a pink circle shows the mouse pointer grabbing the edge.
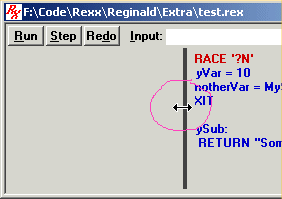
When you resize the Debugger window itself, the height of the RESULTS box is automatically resized.
If your instruction contains a PULL, ARG, or PARSE keyword, the source value being parsed is shown. Also, if some token is thrown away, then the discarded token is displayed.
Consider the following script:
TRACE '?N'
MyVar = 'This is some data'
PARSE VAR MyVar token1 . token2 .
EXIT
Note that we're throwing away the second and fourth pieces (ie, tokens) that we break off. If you Step through the PARSE instruction, this displays the following RESULTS:
MYVAR = "This is some data"
TOKEN1 = "This"
Token discarded: "is"
TOKEN2 = "some"
Token discarded: "data"
<<Done>>
First, because we are using a PARSE VAR instruction, with MYVAR being the source variable, the value of MYVAR is shown. This value is what is being parsed.
Next, the debugger shows that TOKEN1 is referenced and its value is now "This". (Again, the value is put in double quotes, although they are not part of the actual value, so that you can see any leading or trailing spaces on the value).
Next, the debugger shows that the token "is" is being discarded.
The debugger also shows that TOKEN2 is assigned the value "some" and the fourth token of "data" is discarded.
When using the PARSE ARG instruction, the debugger shows each argument that is being parsed. It is prefaced by Arg => and followed by the argument's value in double quotes (although the quotes are not part of the actual value). For example, assume that your script is called by some other script which passes you two arguments of alpha beta gamma delta and 1. Let's assume that your script is named test.rex. The call to your script may look like this:
/* Call text.rex, passing it 2 args of
 * "alpha beta gamma delta" and "1".
 */
CALL test("alpha beta gamma delta", 1)
Now assume that your test.rex script has the following instruction in it:
/* Parse the first argument into 3 tokens,
 * named token.1, token.2, token.3 and toss away
 * any additional characters of it. Parse the
 * second argument into a variable named number,
 * and toss away any additional characters.
 * Ignore all other arguments.
 */
TRACE '?N'
PARSE ARG token.1 token.2 token.3 . , number .
When you Step through this PARSE ARG instruction, the RESULTS box will show:
Arg => "alpha beta gamma delta"
TOKEN.1 = "alpha"
TOKEN.2 = "beta"
TOKEN.3 = "gamma"
Token discarded: "delta"
Arg => "1"
NUMBER = "1"
<<Done>>
If an argument to your script is omitted, then this is noted by the absense of any value after Arg =>. But the PARSE ARG statement nevertheless still parses omitted arguments as if they were empty strings. Consider if test.rex is called as so, with the second arg omitted:
/* Call text.rex, passing it 1 arg of
 * "alpha beta gamma delta".
 */
CALL test("alpha beta gamma delta")
The RESULTS box for the PARSE ARG instruction will show:
Arg => "alpha beta gamma delta"
TOKEN.1 = "alpha"
TOKEN.2 = "beta"
TOKEN.3 = "gamma"
Token discarded: "delta"
Arg =>
NUMBER = ""
<<Done>>
If you do a comparison between two items, then the result of that comparison is displayed (ie, TRUE or FALSE), preceded by the word "Comparison" and the operator used.
For example, assume that you have the following instruction comparing two variables named i and p where i has the value 5 and p has the value 10:
IF i = p THEN SAY "They are equal."If you step through this instruction, it will show the following RESULTS:
I = "5"
P = "10"
= Comparison: FALSE
<<Done>>
Of course, since we referenced both i and p, their values are shown. The line = Comparison: FALSE tells us that our comparison to see if they are equal is FALSE. (ie, They are not equal). And since they are not equal, then the SAY instruction does not get interpreted, so this instruction is done, as indicated by the RESULTS box.
Now let's assume that we have the following instruction:
IF i \= p THEN SAY "They are not equal."If you click the step button once, it will show the following RESULTS:
I = "5"
P = "10"
\= Comparison: TRUE
The line \= Comparison: TRUE tells us that our comparison to see if they are not equal is TRUE. (ie, They are not equal). And since they are not equal, then the SAY instruction will get interpreted, so this test is not yet done, as indicated by the RESULTS box. We have another step to this test. If you click the Step button again, the RESULTS box will clear, and we will proceed to executing the first step of the following SAY instruction (ie, what comes after THEN).
If you use a boolean operator between two items, then the result of that operation is displayed, preceded by the word "Boolean" and the operator used. Many times boolean operators are used to make multiple comparisons in an IF/THEN or WHEN/THEN instruction. For example, if you OR two expressions, and one of them happens to be TRUE, then the boolean result is TRUE (ie, 1).
Assume that we have a variable named MyVar1 whose value is "Hello", and another variable named MyVar2 whose value is "There". Let's examine the RESULTS for the following IF THEN instruction:
IF MyVar1 = "Hello" | MyVar2 = "" THEN NOPThis results in the following:
MYVAR1 = "Hello"
= Comparison: TRUE
MYVAR2 = "There"
= Comparison: FALSE
Boolean OR: TRUE
Since we referenced two variables (MyVar1 and MyVar2), their respective values of "Hello" and "There" are displayed. The RESULTS indicates that the first = comparison (between MyVar1 and the literal string "Hello") is TRUE. (ie, They are equal). The RESULTS indicates that the second = comparison (between MyVar2 and the literal string "") is FALSE. (ie, They are not equal).
Finally, since we are using a boolean OR operator to combine two expressions, the result of that operation is displayed. Since one of the expressions happens to be TRUE (ie, MyVar1 = "HELLO") then the result is TRUE.
If you reference an item prefixed with a '-' sign (ie, to make it negative), then that item's signed value is displayed, preceded by the word Negation to indicate that it is a numeric value with its sign applied.
For example, let's examine the RESULTS for the following instructions:
TRACE '?N'
MyVar = 5
SAY -MyVar
This results in the following for the line SAY -MyVar:
MYVAR = "5"
Negation: -5
The debugger shows that there is a variable referenced whose value is 5 (ie, MyVar). Then, the negative sign is applied to that value, and this signed value is shown.
The Input box can very useful. In addition to being able to type any TRACE instruction into it, and therefore change any debugger options on the fly (in lieu of using the Administration Tool), you can also type any other legal REXX instruction into it.
Among the more useful instructions for debugging is the SAY instruction. This allows you to query the value of any REXX variable in your script, or evaluate the return of any function. For example, let's say that you wish to know the value of the variable named MyVar. Into the Input box, type the following, and then press ENTER:
say myvarThe Input box will be cleared, and the current value of MyVar will appear in that same box. For example, if MyVar's value is "Hello", then Hello appears in the box.
You can also issue a call to any built-in or add-on function. For example, to display the current time, type the following, and then press ENTER:
say time('c')
You can also change the value of any variable in your script by typing an assignment instruction into the Input box. For example, let's say that you wish to change MyVar to the value 5. Into the Input box, type the following, and then press ENTER:
myvar = 5MyVar now has the value 5. If you type a SAY instruction to query its value, you will see this.
Often, you may wish to change the values of some variables while your script is paused, and then re-Run the script, or Redo the current instruction.
You can even combine several instructions in one line, just like you would in a script, separating each with a semi-colon. For example, you set MyVar to 5, and then display its new value, type the following, and then press ENTER:
myvar = 5;say myvar
Another useful thing is to jump to some label in your script. For example, assume that you have the label Here in your script. Into the Input box, type the following, and then press ENTER:
signal hereThe debugger will jump to that label (ie, it will be highlighted in the source lines), still in pause mode. Now you can Run or Step from that point in your script. This is different than setting a breakpoint on the label and Run-ning there. In the latter case, you execute any instructions you pass up to that label. By typing a signal statement into the Input box, you instead jump directly from the current instruction to the desired label.
There are many other useful things that you can type into the Input box. Remember that any legal instruction that you could put into your script, can also be typed directly into the Input box and executed on-the-fly.
The I ("Break on internal subroutine") and A ("Break on add-on function") options are very similiar. The I option automatically breaks (a debugger "Run") on any step that involves a call to one of the subroutines/functions inside of your script, or any call to another REXX script. You are shown the arguments that are being passed to the subroutine/function, but that subroutine/function has not yet been called. As soon as you click the Step or Run buttons, the debugger advances to the first instruction in that subroutine/function/script. This option does not break upon a call to some built-in function, nor a function in an add-on library.
The A option is the same, except instead of subroutines/functions within your script, it breaks only upon a call to some function in an add-on library, such as a REXX Dialog function. This is very useful for when you're trying out the functions in some add-on library. You can quickly "Run" to each such call, and step through it. You may also wish to enable Reginald's TRACE_FUNCS option via the instruction:
OPTIONS 'TRACE_FUNCS'With this option enabled, the Debugger will display each variable in your script that the add-on function queries or sets. So, you can see exactly what variables in your script the add-on library is accessing, and what values those variables have. You can use a TRACE instruction in your script to enable/disable the A or I option, or type the TRACE directly into the Input box. Each time that you use the TRACE instruction, it toggles the option from enabled to disabled, or vice versa. Or you can click on the checkmarks in the Administration Tool window to turn the option on/off.
For example, assuming that the A option is off, to turn it on and display the variables that the add-on function queries/sets, type the following into the Input box, and press ENTER:
OPTIONS 'TRACE_FUNCS TRACE_OPTS';TRACE 'A'
The 'L' ("Break on label") option automatically breaks at any label in your REXX script, or upon the first instruction of any script you call. This can be useful not only in debugging calls to your own subroutines/functions, but also any SIGNAL to some label.
Like with the A option, you can enable/disable the L option from your script or the Input box via a TRACE instruction. Or, you can use the Administation Tool to turn the option on/off.
Whenever a condition is raised, you'll see the following message displayed in the RESULTS box:
Condition raised: Messagewhere Condition is the name of condition raised, ie, NOVALUE, SYNTAX, NOTREADY, ERROR, FAILURE, or HALT, and Message is what would normally be returned by CONDITION('D'). (See CONDITION for details). In our example above, you saw this happen with the NOVALUE condition.
The R ("Break on raise") option causes the debugger to automatically break at the end of any instruction during which a condition is raised. If you "Step" or "Run" at that point, the debugger will proceed to whatever handler you have for that condition, or will do the default action for that condition if you're not handling it. So, the R option is very useful for checking when a condition is raised, and upon which instruction it is raised.
Like with the A option, you can enable/disable the R option from your script or the Input box via a TRACE instruction. Or, you can use the Administation Tool to turn the option on/off.
The E ("Break on error") option is very much like the R option, except it considers only the ERROR and FAILURE conditions. Although you'll still see the above message whenever the other conditions are raised, the debugger will automatically break only when an ERROR or FAILURE condition is raised. The other conditions will not cause an auto-break.
The R option supercedes the E option.
Like with the A option, you can enable/disable the E option from your script or the Input box via a TRACE instruction. Or, you can use the Administation Tool to turn the option on/off.
The F ("Break on failure") option is very much like the E option, except it considers only the FAILURE condition.
The R and E options supercede the F option.
Like with the A option, you can enable/disable the F option from your script or the Input box via a TRACE instruction. Or, you can use the Administation Tool to turn the option on/off.
When REXX encounters a line (in your script) which isn't recognized as a REXX instruction, then REXX passes the line as a "command string" to some other entity. We refer to that entity as an "environment". This environment will be either the program that is used to run your script, such as Reginald's Script Launcher, or if that program doesn't process commands itself, then the operating system's command prompt or shell.
The C option does an auto-breakpoint only at those lines (of your script) where REXX can't recognize the line as being a REXX instruction, and therefore passes the line (as a "command string") to an environment. (The breakpoint happens after the command is passed to the environment, so you may see error messages from the operating system immediately before the debugger breaks, as would likely be the case if you didn't intend to be passing off such a command).
This option can be useful for tracking down errors in which you perhaps misspell a REXX keyword, with the result that REXX can't recognize it and decides to pass the line to some other environment. Or, it can also help you discover where you forget to use the CALL keyword to toss away the return value of some function, such that REXX passes it off to an environment. If you see command prompt windows unexpectedly popping open, or error messages from the operating system, then it is likely due to the second criteria, and the C option is useful for finding such oversights in your script.
Like with the A option, you can enable/disable the C option from your script or the Input box via a TRACE instruction. Or, you can use the Administation Tool to turn the option on/off.
Consider the following script. Assume that the environment is the operating system's shell, and that it supports a command called "echo" which displays any argument to the command prompt window. (ie, It's the shell's equivalent to a REXX SAY keyword). Note that we quote the entire line 'echo hi' so that REXX does not evaluate it at all. (ie, It's a literal string). And since there is no recognizable REXX keyword on that line (outside of quotes), then REXX decides to pass the line to an environment. (ie, Here, that's the operating system shell).
TRACE 'C'
'echo hi'
time = TIME()
This results in the debugger automatically pausing the script after the instruction 'echo hi' is passed off to the operating system. You will see the line highlighted and the RESULTS box will list the results of that instruction.
If the environment happens to return a value after it processes the command string, then this value gets assigned to the special 'RC' variable, which is shown in the RESULTS box. Typically, an environment will return a value of 0 for RC if all went well.
Note: Due to a bug in the Windows 95/98/ME shell, a command string passed to the Windows operating system always returns 0 as its 'RC' value.
When an environment returns an 'RC' value other than 0, this will raise either the ERROR or FAILURE conditions. If the value is a negative number, then FAILURE is raised. Otherwise, ERROR is raised. The E or F options can be useful for automatically breaking upon any such occurence. By using 'E' or 'F' options, you can see which command strings are causing problems.
The O ("Off") option simply turns off the built-in debugger. For example, to turn off the built-in debugger, you use the instruction:
TRACE 'O'You can put this at any point in your script, or type it into the Input box and press ENTER. Alternately, you can type RETURN into the Input box and press ENTER.
You can also turn off the debugger by selecting the Administration Tool's "Off" mode (or "Let script set" mode, assuming that the script does not contain a TRACE instruction). You can turn the debugger back on at any time using the Administration Tool's "Run" or "Step" modes (depending upon whether you want it to open initially in Run or Step mode, respectively).
You can abort a script at any time by simply closing the Debugger window. This is different than turning off the debugger by using a TRACE 'O', or the Administration Tool's "Off" or "Let script set" modes. The latter simply close the debugger window and allow the script to run as normal (until another TRACE instruction, or you change the Administration Tool to "Run" or "Step" modes).
You can also abort by typing EXIT into the Input box and pressing ENTER.
If you'd like to tell the debugger to redo the currently highlighted instruction (perhaps after you've set some variables to new values, by typing assignment instructions into the Input box), then click the "Redo" button. The RESULTS box will be cleared and the instruction will be redone starting from the first step.
If you'd like to skip ahead several instructions, then type into the Input box:
TRACE xxxwhere xxx is the number of instructions to skip over. These instructions are executed, and displayed in the debugger window, but the debugger doesn't stop for any manual or auto-breakpoints until those instructions are done.